




|
Net Applications - Usage Share Statistics for Internet Technologies. |
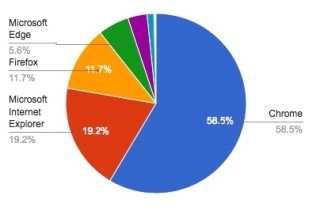
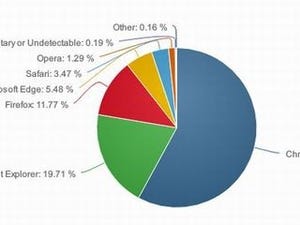
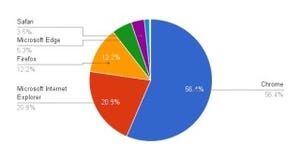
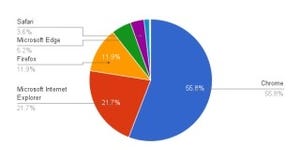
Net Applicationsから2017年3月のデスクトップブラウザシェアが発表された。3月はChromeとFirefox、Microsoft Edgeがシェアを増やし、Internet ExplorerとSafariがシェアを減らした。しかし、シェアの変動は小幅にとどまっている。
Internet Explorerは全体としてはシェアを減らしたものの、Internet Explorer 9.0のシェアが半減したのに対し、Internet Explorer 11.0、Internet Explorer 10.0、Internet Explorer 8.0はシェアを増やしている。Internet Explorer 9.0のシェアがほかのバージョンに移行したものと見られる。
MicrosoftはInternet ExplorerからMicrosoft Edgeへの移行を促したい意向だが、ユーザーはChromeなどほかのWebブラウザへ移行する傾向を見せている。Internet Explorerの減少幅ほど、Microsoft Edgeはシェアを確保できていない状況にある。

|

|
2017年3月ブラウザシェア/円グラフ - Net Applications報告 |
2017年3月バージョン別ブラウザシェア/円グラフ - Net Applications報告 |

|
2017年3月ブラウザシェア/棒グラフ - Net Applications報告 |

|
2017年3月バージョン別ブラウザシェア/棒グラフ - Net Applications報告 |
| 順位 | プロダクト | 今月のシェア | 先月のシェア | 推移 |
|---|---|---|---|---|
| 1 | Chrome | 58.64% | 58.53% | ↑ |
| 2 | Microsoft Internet Explorer | 18.95% | 19.17% | ↓ |
| 3 | Firefox | 11.79% | 11.68% | ↑ |
| 4 | Microsoft Edge | 5.61% | 5.55% | ↑ |
| 5 | Safari | 3.37% | 3.45% | ↓ |
| 6 | Opera | 1.18% | 1.22% | ↓ |
| 7 | proprietary/undetectable | 0.29% | 0.21% | ↑ |
| 8 | Opera Mobile | 0.01% | 0.01% | = |
| 9 | Konqueror | 0.01% | 0.01% | = |
| 10 | Android Browser | 0.00% | 0.01% | ↓ |
| 順位 | プロダクト | 今月のシェア | 先月のシェア | 推移 |
|---|---|---|---|---|
| 1 | Chrome 56.0 | 36.75% | 29.31% | ↑ |
| 2 | Microsoft Internet Explorer 11.0 | 12.47% | 11.51% | ↑ |
| 3 | Chrome 45.0 | 5.72% | 6.18% | ↓ |
| 4 | Microsoft Edge 14 | 4.84% | 4.84% | = |
| 5 | Firefox 51 | 3.86% | 7.13% | ↓ |
| 6 | Firefox 52 | 3.71% | 0% | ↑ |
| 7 | Microsoft Internet Explorer 8.0 | 3.26% | 3.18% | ↑ |
| 8 | Chrome 49.0 | 3.15% | 3.31% | ↓ |
| 9 | Chrome 57.0 | 2.06% | 0% | ↑ |
| 10 | Safari 10.0 | 2.04% | 2.07% | ↓ |
| 11 | Microsoft Internet Explorer 9.0 | 1.76% | 3.08% | ↓ |
| 12 | Chrome 55.0 | 1.72% | 10.44% | ↓ |
| 13 | Chrome 50.0 | 1.31% | 1.17% | ↑ |
| 14 | Chrome 53.0 | 1.30% | 1.11% | ↑ |
| 15 | Microsoft Internet Explorer 10.0 | 1.06% | 0.88% | ↑ |


 Windows 11 26H2にWindows 95のメモリ管理コードが残る理由