
Net Applicationsから2018年11月のモバイルOSのシェアが発表された。2018年11月はAndroidがシェアを減らし、iOSがシェアを増やした。どの程度シェアに影響を与えたかは不明だが、2018年11月はAppleのタブレット新製品であるiPad Pro (2018)の販売時期やiPhoneの新製品であるiPhone XRなどの販売時期と重なっている。
2018年10月におけるAndroidとiOSのシェアの合算値は98.56%、2018年11月におけるAndroidとiOSのシェアの合算値は98.50%とシェアのほとんどを占めている。AndroidとiOSの合算値は変わらずに、両者のシェアが毎月変化するという動向が続いている。
-
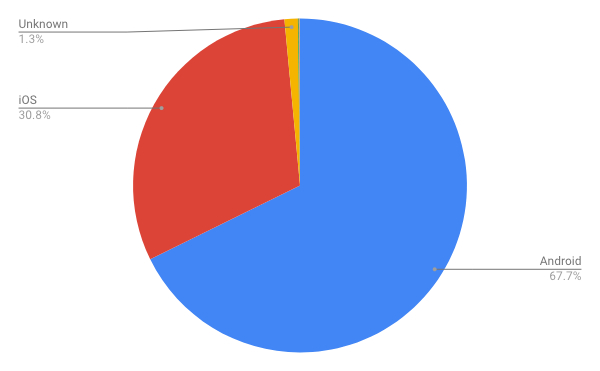
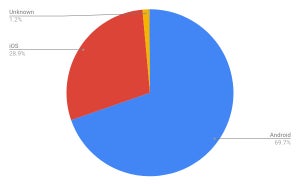
2018年11月モバイルOSシェア/円グラフ - Net Applications

-
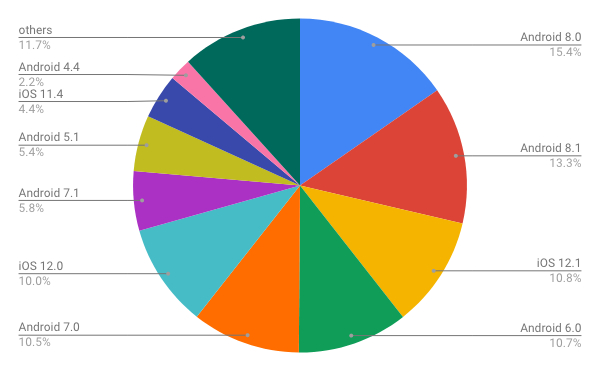
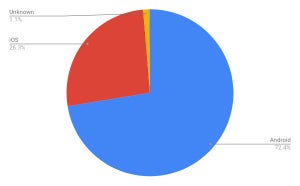
2018年11月モバイルOSバージョン別シェア/円グラフ - Net Applications

-
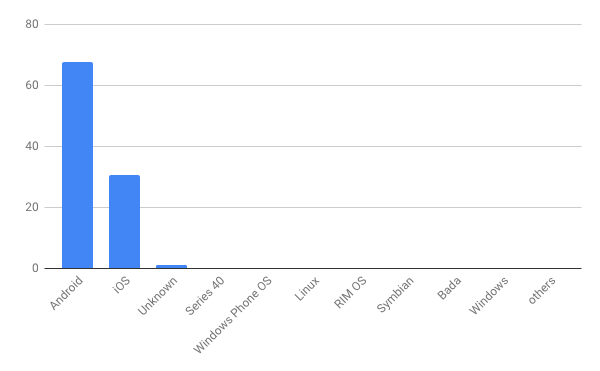
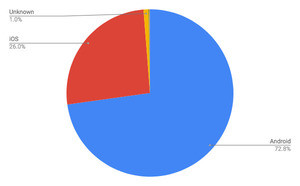
2018年11月モバイルOSシェア/棒グラフ - Net Applications

-
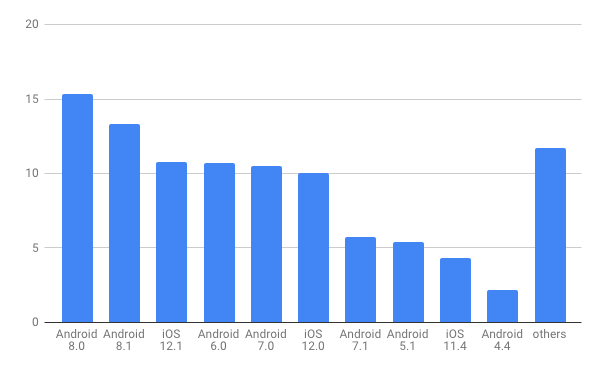
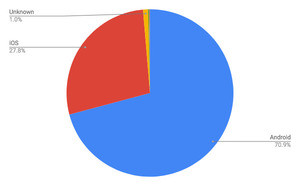
2018年11月モバイルOSバージョン別シェア/棒グラフ - Net Applications

| 順位 | プロダクト | 今月のシェア | 先月のシェア | 推移 |
|---|---|---|---|---|
| 1 | Android | 67.71% | 69.68% | ↓ |
| 2 | iOS | 30.79% | 28.88% | ↑ |
| 3 | Unknown | 1.29% | 1.20% | ↑ |
| 4 | Series 40 | 0.08% | 0.08% | = |
| 5 | Windows Phone OS | 0.06% | 0.09% | ↓ |
| 6 | Linux | 0.03% | 0.03% | = |
| 7 | RIM OS | 0.02% | 0.03% | ↓ |
| 8 | Symbian | 0.01% | 0.01% | = |
| 9 | Bada | 0.00% | 0.00% | = |
| 10 | Windows | 0.00% | 0.00% | = |
| 順位 | プロダクト | 今月のシェア | 先月のシェア | 推移 |
|---|---|---|---|---|
| 1 | Android 8.0 | 15.35% | 16.19% | ↓ |
| 2 | Android 8.1 | 13.31% | 11.01% | ↑ |
| 3 | iOS 12.1 | 10.76% | ー | ↑ |
| 4 | Android 6.0 | 10.69% | 11.62% | ↓ |
| 5 | Android 7.0 | 10.50% | 11.95% | ↓ |
| 6 | iOS 12.0 | 10.01% | 15.65% | ↓ |
| 7 | Android 7.1 | 5.76% | 6.61% | ↓ |
| 8 | Android 5.1 | 5.42% | 5.93% | ↓ |
| 9 | iOS 11.4 | 4.35% | 6.77% | ↓ |
| 10 | Android 4.4 | 2.15% | 2.27% | ↓ |